on
Jobmined, Part II (ish) [2]
This is a continuation of my previous post.
Let's take a look at the posting breakdowns by faculty. There were 94 unique disciplines represented during the first weekend of JobMine postings.
This all goes to show that there are a lot of co-op programs here at the University of Waterloo. I believe the official number, according to the registrar's office, is over 120 different undergraduate programs.
Demand
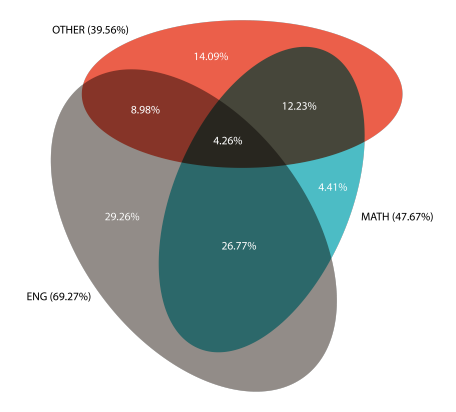
Thankfully the data was graphable on an planar area-proportionate Eulerian graph using ellipses (using eulerAPE and then doing some post-processing in Photoshop to make it look better, since I couldn't find a Python or R library that could do what I wanted). From STAT 230, this is because if you assume their areas (or probabilities) sum to 1, this results in 6 free parameters. However, this may not always result in a planar graph.
For the sake of simplifying the computation, I've combined a few of the job posting disciplines together under the "other" category, which includes faculties like Applied Health Science (AHS), Science (SCI), Environment (ENV), as well as all the disciplines targeting an umbrella category—like All Business (unspecified), All Chart Prof Acct (CPA), All Finance (unspecified), All Health Informatics, All Info Tech (unspecified), to name a few.
To no big surprise, the demand for technology jobs is significantly higher than all the other faculties.
If you’re an Engineering or Math student, there's good news—there are jobs for you, even in this crappy economy! Roughly 85.91% of jobs on JobMine during the first round this term were targeted towards Math or Engineering students.
This is somewhat disheartening for students in the other faculties (Arts, Applied Health Sciences, and Science) who make up the remaining 14.09%, but then again, students aren't limited to applying for jobs with disciplines targeting their faculties. Personally, I've always applied to "ENG-Software" and "ENG-Computer" jobs, which may not cross-list "MATH-Computer Science" as one of the targeted disciplines.
In fact, 60.44% of postings were exclusively targeted at MATH and Engineering students (the bottom three sections in the diagram above). That's somewhat surprising, considering that according to the official headcounts, out of the 34126 undergraduate students enrolled in Fall 2015, 8409 were Engineering students, and 7074 MATH students—making up 45.37% of the undergraduate population.
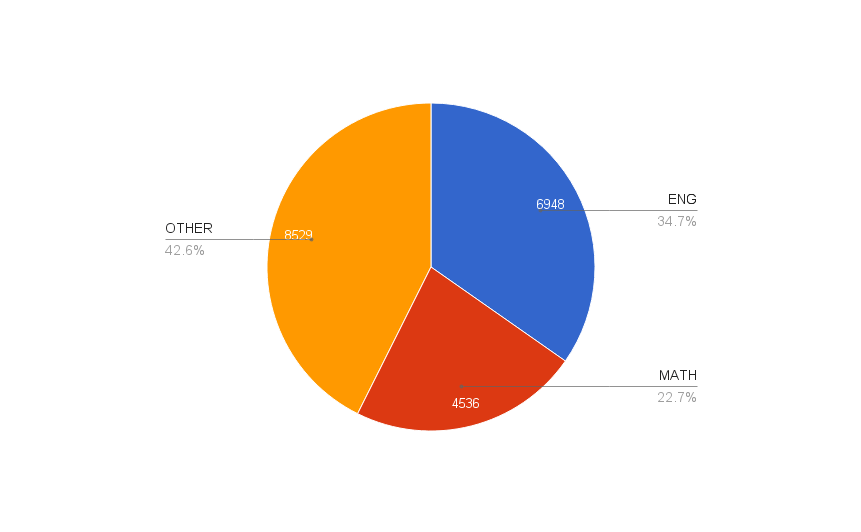
But I guess if you just consider the co-op population, these proportions don't seem as ridiculous. In Fall 2015, there were a total of 20013 co-op students enrolled, 6948 of which were in ENG, and 4536 in MATH, meaning that combined, ENG and MATH made up 57.38% of the co-op students. Regardless, it's still not quite an equal proportion.
However, this actually might be undercounting jobs that only target disciplines such as All Info Tech (unspecified) that target Math and Engineering students!
Here's another visualization of the data, but with all the different disciplines. Just for kicks, I tried playing around with a network graph to show the edges between different disciplines, but there's just so much going on (and so many different edges) that it's virtually impossible to understand or gain any insights from the graph. I don't think this network graph is too useful, but it sure looks pretty cool.

Note: I realized about halfway through making the Eulerian plot that I probably could've simplified my calculations using Bayesian principles. Also, shoutout to Wolfram|Alpha for row-reducing my 7x8 matrix to solve the system of 7 linear equations.
Supply
While there isn't any indication as to how many number of co-op students of each faculty are applying in JobMine, we can sort of estimate using the number of applications job postings targeting various faculties receive. Official headcount data only gives the number of co-op students, but some of them may be applying externally (or already have offers lined up, like my roommate).
If a job showed up in multiple disciplines, it was counted towards both.
Note: I've removed the outliers to maintain a clean boxplot, which provides a simple way to visualize the five-number summary. The left bound of the box represents the first quartile (Q1), while the right bound is the third quartile (Q3), such that 50% of the values are between Q1 and Q3. The line in the middle is the median.
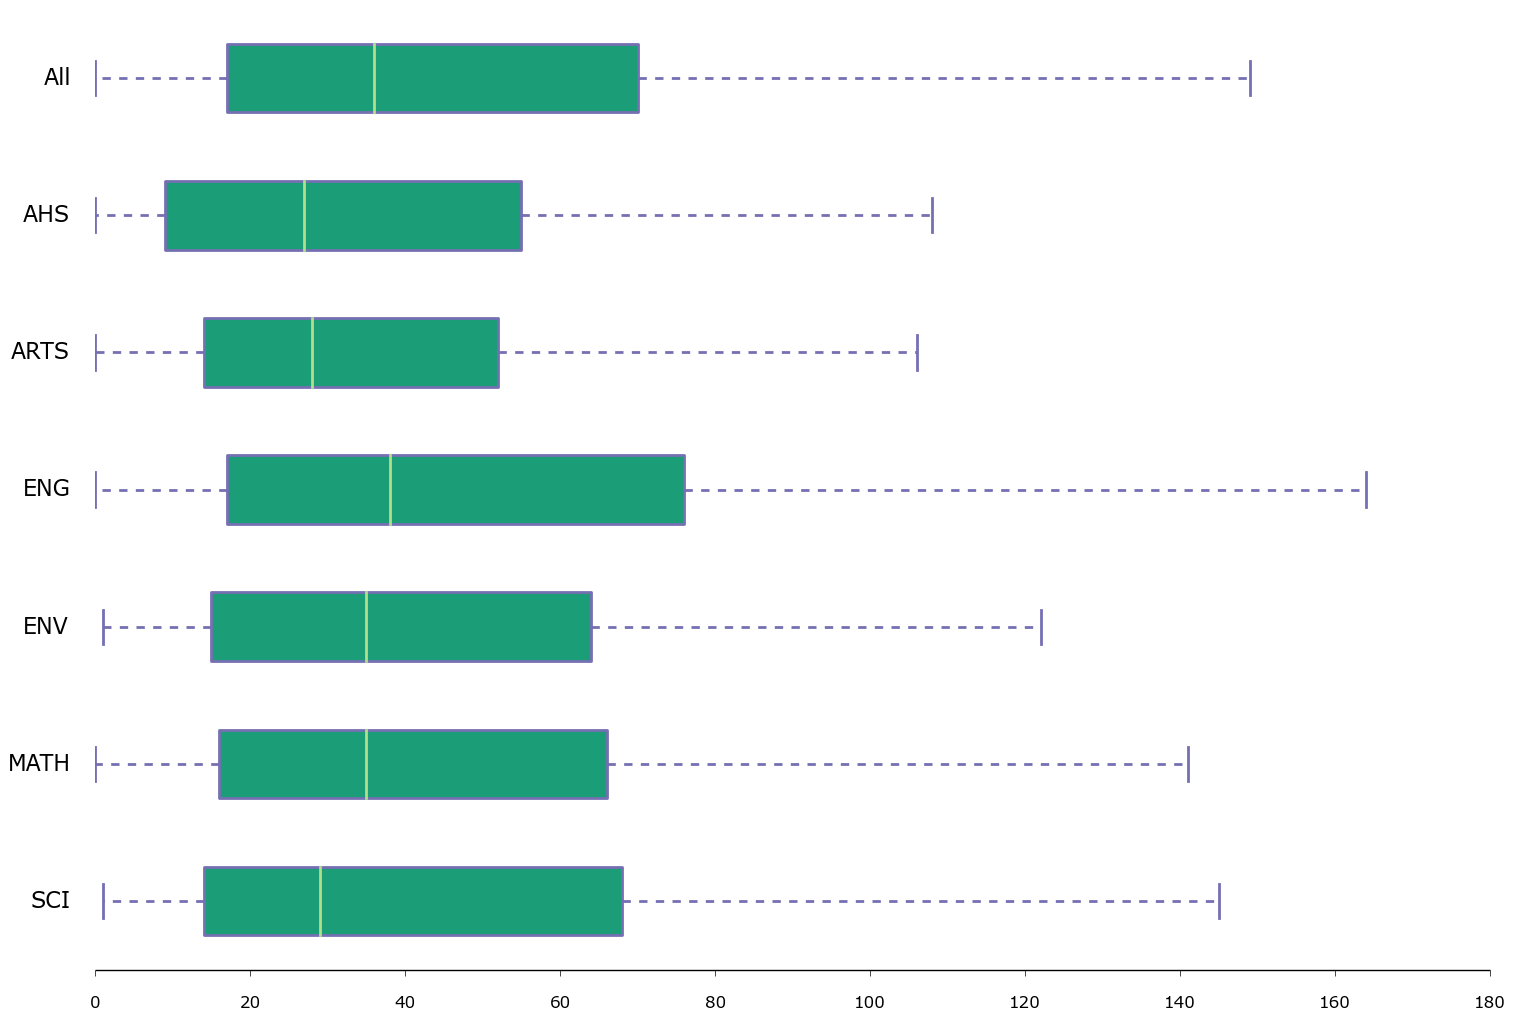
Job postings targeting ENG students get the highest number of applications. Job postings targeting ARTS gets the least number of postings. However, ENG postings also have the most spread, while ARTS has the least.
For the purists, here's the same graph, but with the outliers included. I don't think it's as useful as the previous graph, but here it is anyways.
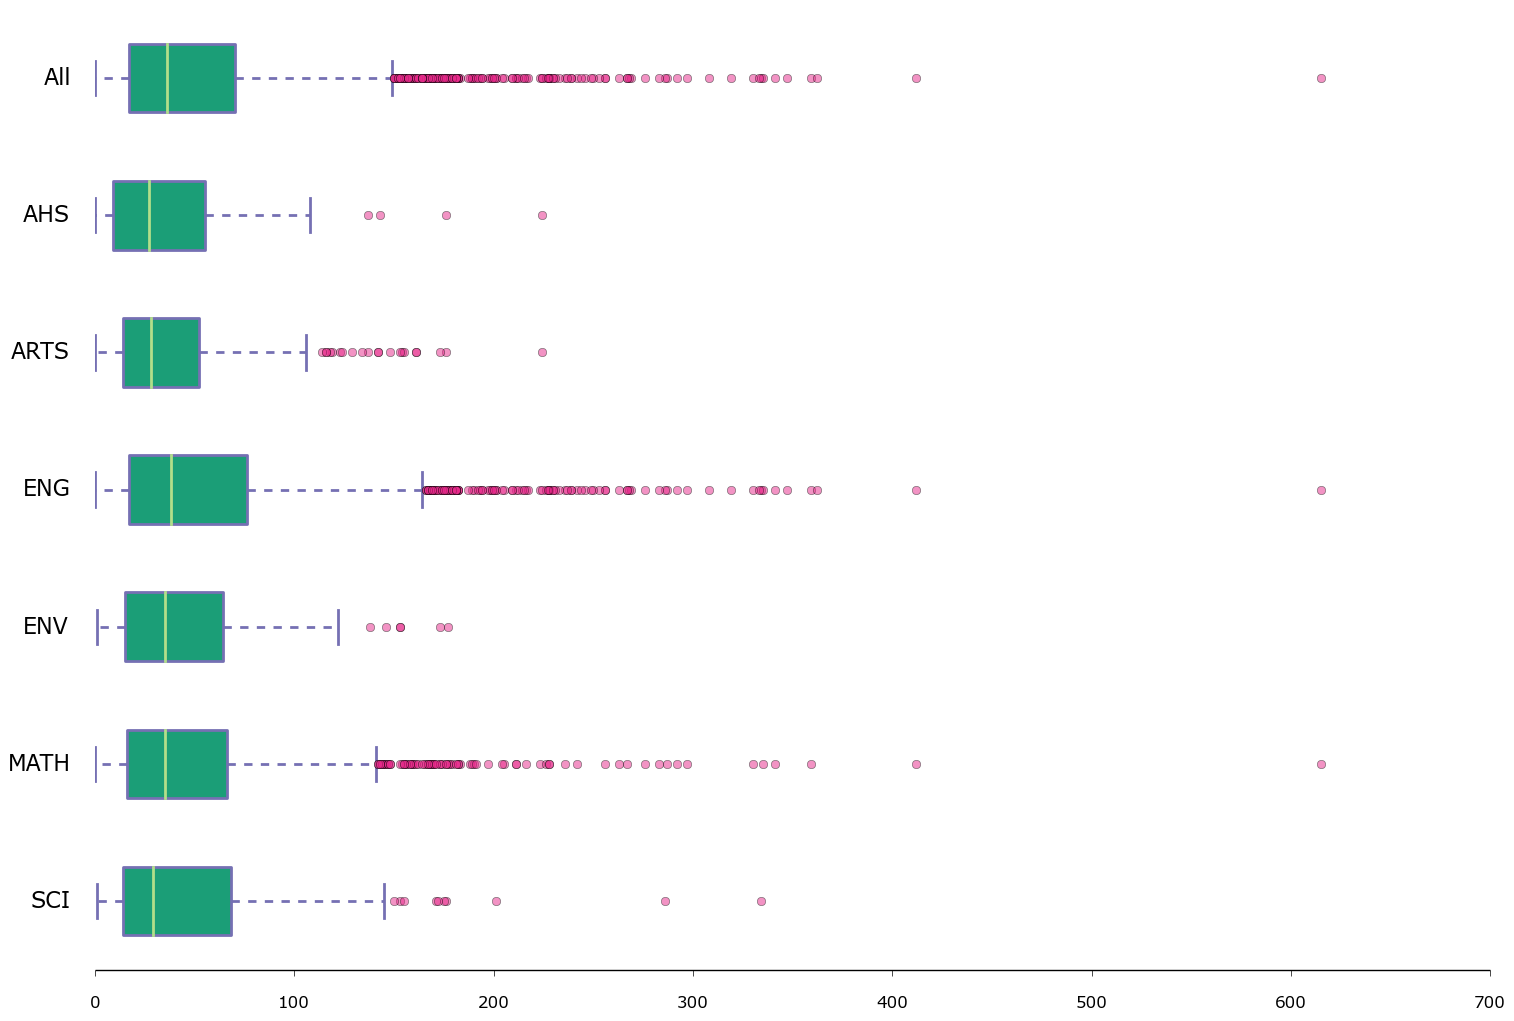
I'm fairly certain that the jobs with 600+ applications are for the large tech companies, considering how they line up perfectly for the ENG and MATH faculties.
Languages
I thought it'd be neat to see what programming languages employers were adding to their job descriptions. This would've been a good opportunity to compare with the 2010 dataset. Back in 2010, Node.js hadn't yet begun to pick up the following it has today—heck, there weren't even Windows binaries for it, or even npm! And nowadays, it seems like every single startup I see is using Node.js.
Just off the top of my head, there's been at least 3 new programming languages that have garnered some significance since the year 2010—Swift, Elixir, and Rust.
I brainstormed a few tech-related keywords and programming languages, and modified my tokenizer to match against programming languages or words relating to their tech stack (and some other buzzwords) tokens in the job descriptions. While the choice of words here is somewhat arbitrary, I think they're fairly representative of what you'd work with or hear at a programming job.
For some words, multiple tokens were combined together to account for the various possible spellings (such as node.js, nodejs, NodeJS, nodejs, Node.js, node)—and don't even get me started on people's inabilities to spell, despite having access to spellcheck.
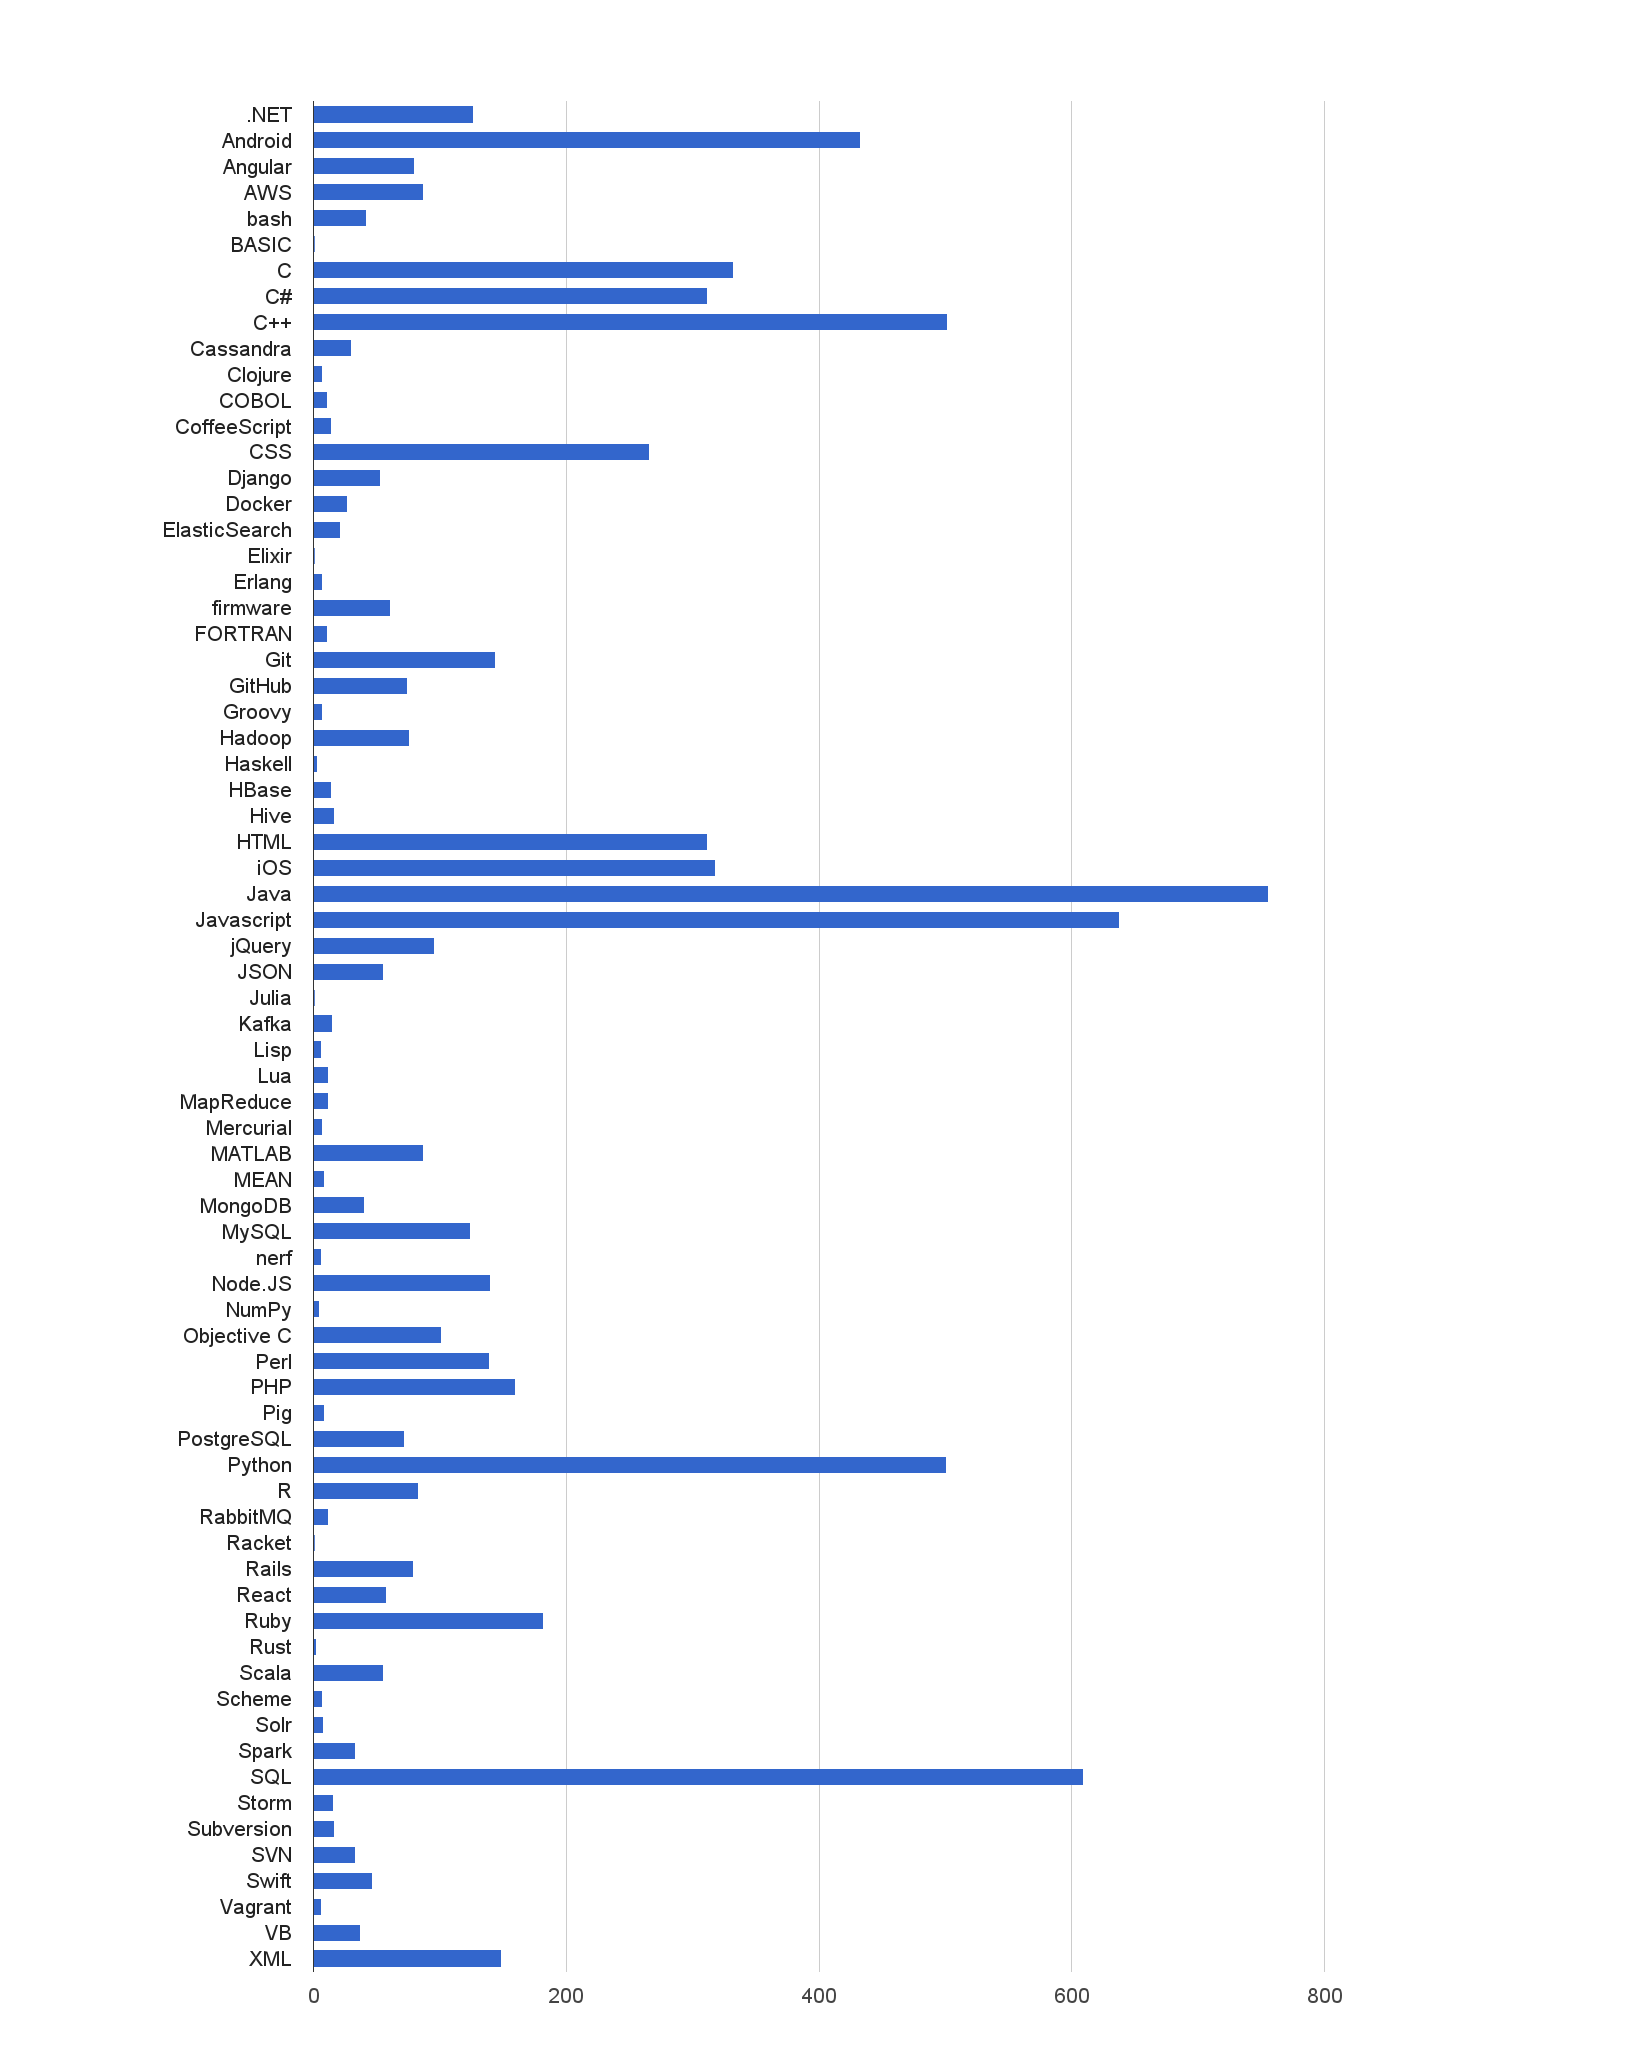
Surprisingly, people are still looking for COBOL, FORTRAN and BASIC programmers. It's been over 50 years, and yet these programming languages still have some presence. Talk about job security…
Being familiar with Bash is also useful, so pay attention in CS 246 and learn how to write bash scripts.
For version control systems, Git seems to be the new SVN, while Mercurial hasn't really ever caught on. And lots of employers are looking for GitHub profiles and side projects/open-source contributions.
In addition, anything related to "big data" and to a certain extent, distributed-systems, is hot. Everyone wants to build a distributed system and optimize all their metrics.

Plus, nerf guns. Nerf guns. They're mentioned more often than Haskell!
The takeaway? Learn SQL. Know Java. Pick up C/C++/C# if you can. Python is a cool language to learn too, especially if you're trying to get into data science. GitHub profiles and open-source contributions are nice to have. Node.js and the MEAN stack are popular, but not that popular in the grand scheme of things (compared to Java, C, C++, and C#). The trifecta of HTML/CSS/JavaScript is a good choice if you're desperate for programming jobs. R, MATLAB, and any other data-science related tools (Hive, Spark, Storm, Pig) are gaining in popularity.
And if you had to pick between Android and iOS, just keep in mind that there's more noise over on the Android side of the fence.